def文を用いて共通の処理を関数化する
以下の2つの記事の応用編です。 今回のポイントは以下の2つです。 ・気温の処理を関数化・Matplotlibで複数のグラフを出力 コードはGitHubリポジトリにあげています。 コード 出力結果 以下の様な気温と降水確率 […]
Filter by Category
以下の2つの記事の応用編です。 今回のポイントは以下の2つです。 ・気温の処理を関数化・Matplotlibで複数のグラフを出力 コードはGitHubリポジトリにあげています。 コード 出力結果 以下の様な気温と降水確率 […]
前回作った気象庁のサイトからBeautifulSoup4を使ってスクレイピングするプログラムの応用編として、今回はiOSアプリのPythonistaを使って最高気温と最低気温をグラフ化します。グラフ化にはMatplotl […]
以下の2つの記事の応用編です。 今回のポイントは以下の2つです。
・気温の処理を関数化
・Matplotlibで複数のグラフを出力
コードはGitHubリポジトリにあげています。
import datetime
import re
import urllib.request

import matplotlib.pyplot as plt
from bs4 import BeautifulSoup


def temp_generate(temps):
    temp_list = []

    for temp in temps:
        temp = temp.text

        if '最低' not in temp and '最高' not in temp:
            temp = temp.replace('\n|\t', '').replace('(', '{').replace(')', '}')
            temp = re.sub('{.*?}', '', temp)

            if '/' in temp:
                temp = None
            else:
                temp = int(temp)

            temp_list.append(temp)

    return temp_list


url = urllib.request.urlopen('https://www.jma.go.jp/jp/week/315.html')
soup = BeautifulSoup(url, 'lxml')

days = soup.find("table", {"id": "infotablefont"}).find_all("tr")[0].find_all("th")
rainy = soup.find("table", {"id": "infotablefont"}).find_all("tr")[2].find_all("td")
max_temp = soup.find("table", {"id": "infotablefont"}).find_all("tr")[4].find_all("td")
min_temp = soup.find("table", {"id": "infotablefont"}).find_all("tr")[5].find_all("td")

day_list = []
for day in days:
    day = day.text

    if '日付' not in day:
        day_list.append(day[:-1])

hour = datetime.datetime.now().hour

rainy_list = []
for rain in rainy:
    rain = rain.text

    if '降水確率' not in rain:
        if '/' in rain:
            if 0 <= hour < 6:
                rain = rain.split('/')[0]
            elif 6 <= hour < 12:
                rain = rain.split('/')[1]
            elif 12 <= hour < 18:
                rain = rain.split('/')[2]
            elif 18 <= hour < 24:
                rain = rain.split('/')[3]
        else:
            pass

        rainy_list.append(int(rain))

maxtemp_list = temp_generate(max_temp)
mintemp_list = temp_generate(min_temp)

x = day_list
plt.subplot(2, 1, 1)
plt.plot(x, maxtemp_list, label='Max', color="red", marker="o")
plt.plot(x, mintemp_list, label='Min', color="blue", marker="o")
plt.title("Weekly weather")
plt.xlabel("Day")
plt.ylabel("Temp")
plt.legend()

plt.subplot(2, 1, 2)
plt.plot(x, rainy_list, marker="o")
plt.title("Rainy percent")
plt.ylabel("Percent")

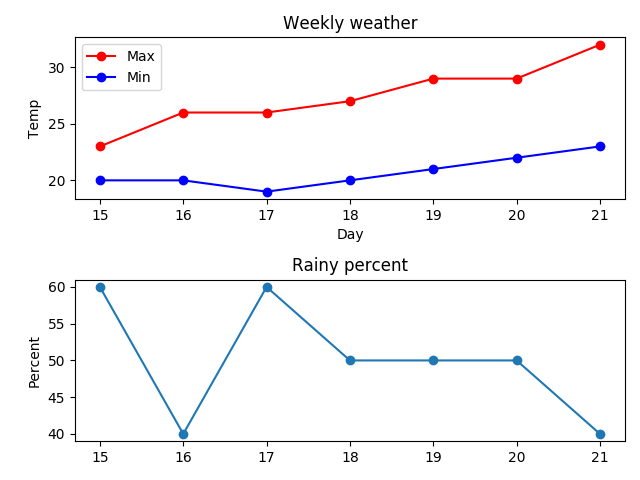
plt.show()以下の様な気温と降水確率のグラフが表示されます。

def temp_generate(temps):
    temp_list = []

    for temp in temps:
        temp = temp.text

        if '最低' not in temp and '最高' not in temp:
            temp = temp.replace('\n|\t', '').replace('(', '{').replace(')', '}')
            temp = re.sub('{.*?}', '', temp)

            if '/' in temp:
                temp = None
            else:
                temp = int(temp)

            temp_list.append(temp)

    return temp_list
最高気温と最低気温の処理を関数化した部分です。最高気温と最低気温はどちらも同じ処理なので関数化します。今回の気温を抜き出す様な処理は関数化することで、一度の記述で済むので記述量を減らせます。
Pythonの関数は以下の様に関数を定義します。
def 関数名():
    処理
def temp_generate(temps):
temp_generateという関数を作り、引数にはtempsを指定します。return temp_list
temp_generate関数は作成した気温のリストを返します。
maxtemp_list = temp_generate(max_temp)mintemp_list = temp_generate(min_temp)
取得した気温情報をtemp_generate関数に渡し、関数内で作成したリストを受け取ります。
hour = datetime.datetime.now().hour

rainy_list = []
for rain in rainy:
    rain = rain.text

    if '降水確率' not in rain:
        if '/' in rain:
            if 0 <= hour < 6:
                rain = rain.split('/')[0]
            elif 6 <= hour < 12:
                rain = rain.split('/')[1]
            elif 12 <= hour < 18:
                rain = rain.split('/')[2]
            elif 18 <= hour < 24:
                rain = rain.split('/')[3]
        else:
            pass

        rainy_list.append(int(rain))
直近の降水確率は時間帯毎に表示されているので、現在時刻から適切な降水確率を抜き出します。
hour = datetime.datetime.now().hour
現在の時間(時のみ)を取得します
rain = rain.split('/')[0]
表示されている数値は/で区切られているので、/の前後の位置を指定して取得します。
x = day_list
plt.subplot(2, 1, 1)
plt.plot(x, maxtemp_list, label='Max', color="red", marker="o")
plt.plot(x, mintemp_list, label='Min', color="blue", marker="o")
plt.title("Weekly weather")
plt.xlabel("Day")
plt.ylabel("Temp")
plt.legend()

plt.subplot(2, 1, 2)
plt.plot(x, rainy_list, marker="o")
plt.title("Rainy percent")
plt.ylabel("Percent")

plt.show()
plt.subplot(2, 1, 1)plt.subplot(2, 1, 2)
2つのグラフを縦に並べて出力します。
群馬県でPythonを使ったAIやソフトウェアを開発している株式会社ファントムが運営しています。
Comments