Pythonistaを使って最高気温と最低気温をグラフ化
前回作った気象庁のサイトからBeautifulSoup4を使ってスクレイピングするプログラムの応用編として、今回はiOSアプリのPythonistaを使って最高気温と最低気温をグラフ化します。グラフ化にはMatplotl […]
Filter by Category
前回作った気象庁のサイトからBeautifulSoup4を使ってスクレイピングするプログラムの応用編として、今回はiOSアプリのPythonistaを使って最高気温と最低気温をグラフ化します。グラフ化にはMatplotl […]
Pythonistaには多くのモジュールがプリインストールされていて、スクレイピングに必要なBeautifulSoupも初めから使える様になっています。そこで、今回はiOSアプリのPythonistaを使ってiPhone […]
iPhoneとiPadから使えるPythonistaというアプリを使ってFlaskからHello World!する方法です。 Pythonistaはプリインストールされたモジュールが充実していて、バージョンも2.7か3. […]
前回作った気象庁のサイトからBeautifulSoup4を使ってスクレイピングするプログラムの応用編として、今回はiOSアプリのPythonistaを使って最高気温と最低気温をグラフ化します。グラフ化にはMatplotlibを使用します。
基本的なコードは前回の記事と同じなので、詳しい説明が見たい方はこちらからどうぞ。
基本的には前回のコードと同じですが、Pythonistaではlmxlが使用できないので、soup = BeautifulSoup(url, 'html.parser')としてhtml.parserを使用しています。
import urllib.request
from bs4 import BeautifulSoup
import re
import matplotlib.pyplot as plt

url = urllib.request.urlopen('https://www.jma.go.jp/jp/week/315.html')
soup = BeautifulSoup(url, 'html.parser')

days = soup.find("table", {"id": "infotablefont"}).find_all("tr")[0].find_all("th")
max_temp = soup.find("table", {"id": "infotablefont"}).find_all("tr")[4].find_all("td")
min_temp = soup.find("table", {"id": "infotablefont"}).find_all("tr")[5].find_all("td")

daylist = []
for day in days:
	day = day.text

	if '日付' not in day:
		daylist.append(day[:-1])

maxtemplist = []
for maxtemp in max_temp:
	maxtemp = maxtemp.text

	if '最高' not in maxtemp:
		maxtemp = maxtemp.replace('\n', '').replace('\t', '').replace('(', '{').replace(')', '}')
		maxtemp = re.sub('{.*?}', '', maxtemp)

		if '/' in maxtemp:
			maxtemp = None
		else:
			maxtemp = int(maxtemp)

		maxtemplist.append(maxtemp)

mintemplist = []
for mintemp in min_temp:
	mintemp = mintemp.text

	if '最低' not in mintemp:
		mintemp = mintemp.replace('\n', '').replace('\t', '').replace('(', '{').replace(')', '}')
		mintemp = re.sub('{.*?}', '', mintemp)

		if '/' in mintemp:
			mintemp = None
		else:
			mintemp = int(mintemp)

		mintemplist.append(mintemp)

x = daylist
plt.plot(x, maxtemplist, label='Max', color="red", marker="o")
plt.plot(x, mintemplist, label='Min', color="blue", marker="o")
plt.title("Weekly weather")
plt.xlabel("Day")
plt.ylabel("Temp")
plt.legend()
plt.show()
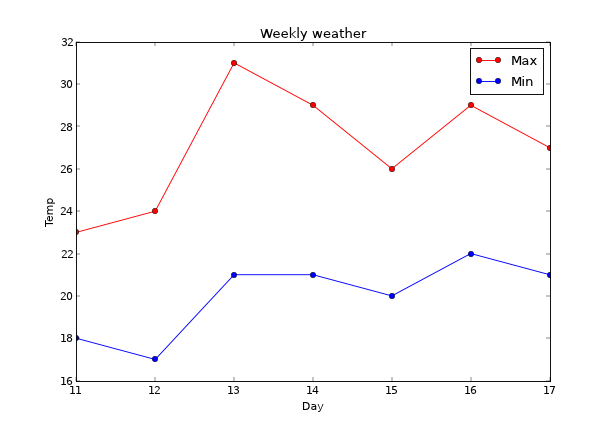
x = daylistは、一週間分の件数を代入しています。plt.plot(x, maxtemplist, label='Max', color="red", marker="o")、plt.plot(x, mintemplist, label='Min', color="blue", marker="o")は、順番に一週間分の件数、最高・最低気温のリスト、ラベル名、線の色、マーカーの種類を指定しています。plt.title("Weekly weather")は、タイトルを指定しています。plt.xlabel("Day")は、X軸のラベル名を指定しています。plt.ylabel("Temp")は、Y軸のラベル名を指定しています。plt.legend()は、凡例を表示します。plt.show()は、グラフを表示します。
Pythonistaの画面

以下の様なグラフが出力されます。

群馬県でPythonを使ったAIやソフトウェアを開発している株式会社ファントムが運営しています。
Comments
[…] Pythonistaを使って最高気温と最低気温をグラフ化 […]